From 0 to 1: Defining the Product Design Architecture for UCOMP AET Remote O&M Platform
01 | Team Goal
To create a comprehensive design system that standardizes user experience across all enterprise applications, ensuring consistency, efficiency, and scalability.
02 | Role & Output
As Lead UX Designer, I architected the design system foundation, created 50+ reusable components, established design principles, and built comprehensive documentation for designers and developers.
03 | Challenge
Addressing inconsistent UI patterns across multiple products, reducing duplicated effort, improving accessibility standards, and accelerating product development cycles.
04 | Impact & Results
平台成功承载 400 辆无人车稳定运行,大幅提升了人机比运维效率,并在实际场景中有效缩短了故障响应时间,确保了工业物流的闭环安全性。同时 UCOMP 产品设计获得中国信通院无人驾驶车辆远程运维国家标准奖项。
Project Background
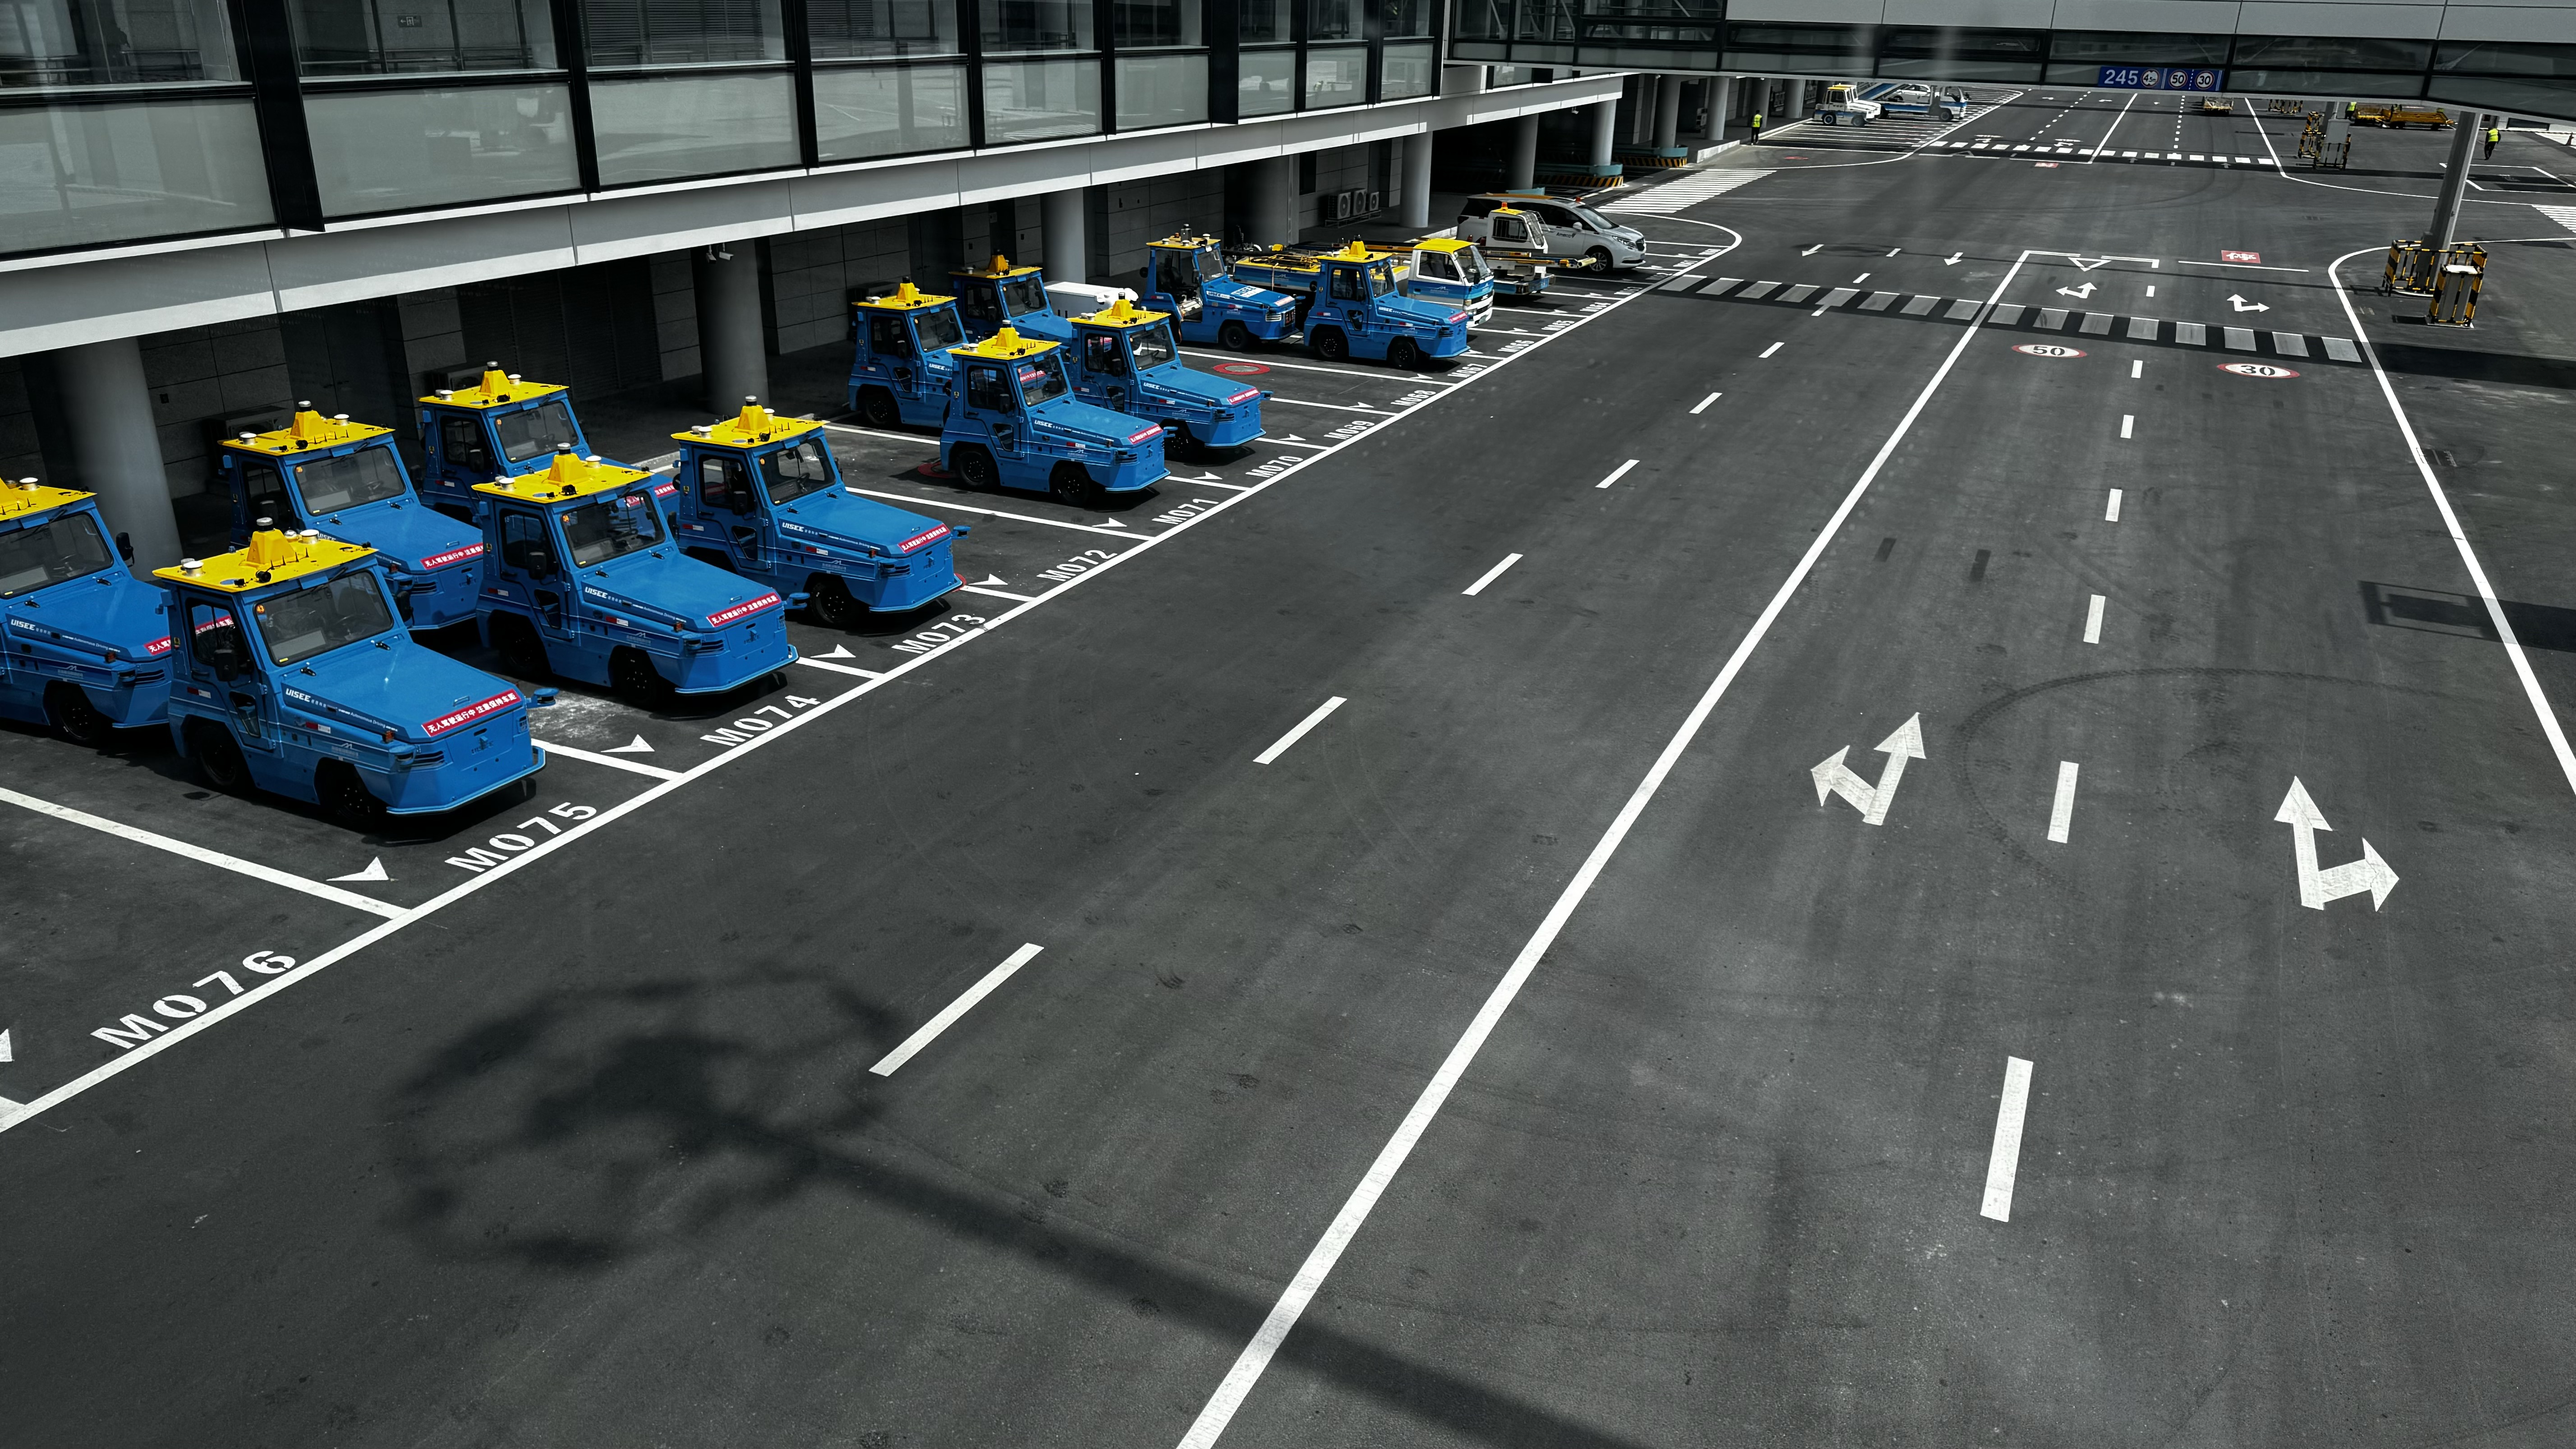
As UISEE's autonomous driving business transitioned from technology validation to large-scale commercial deployment, front-line operations faced a fundamental leap — from managing individual test vehicles to orchestrating fleets of hundreds of driverless transport vehicles. In the early stages, the absence of a unified centralized management tool meant operations remained heavily reliant on on-site manual intervention and fragmented raw logs. The internal platform operations team identified this critical gap and initiated a product requirement: to build the UISEE Central Remote Operations Platform — a system capable of carrying real-time monitoring responsibilities for all autonomous transport vehicles across every active project.
As the lead designer on this project, I took ownership of the end-to-end design of UCOMP, from zero to one. The goal was to create a "cloud command center" capable of supporting 400+ vehicle fleets at scale, integrating real-time situational awareness with remote safe takeover capabilities — filling the company's gap in large-scale unmanned fleet remote operations infrastructure. We set out to build a centralized "digital brain" that could translate complex vehicle-layer signals into intuitive operational language, ensuring that platform operators could maintain precise command over every vehicle's status, even in demanding industrial environments.
Core Challenge
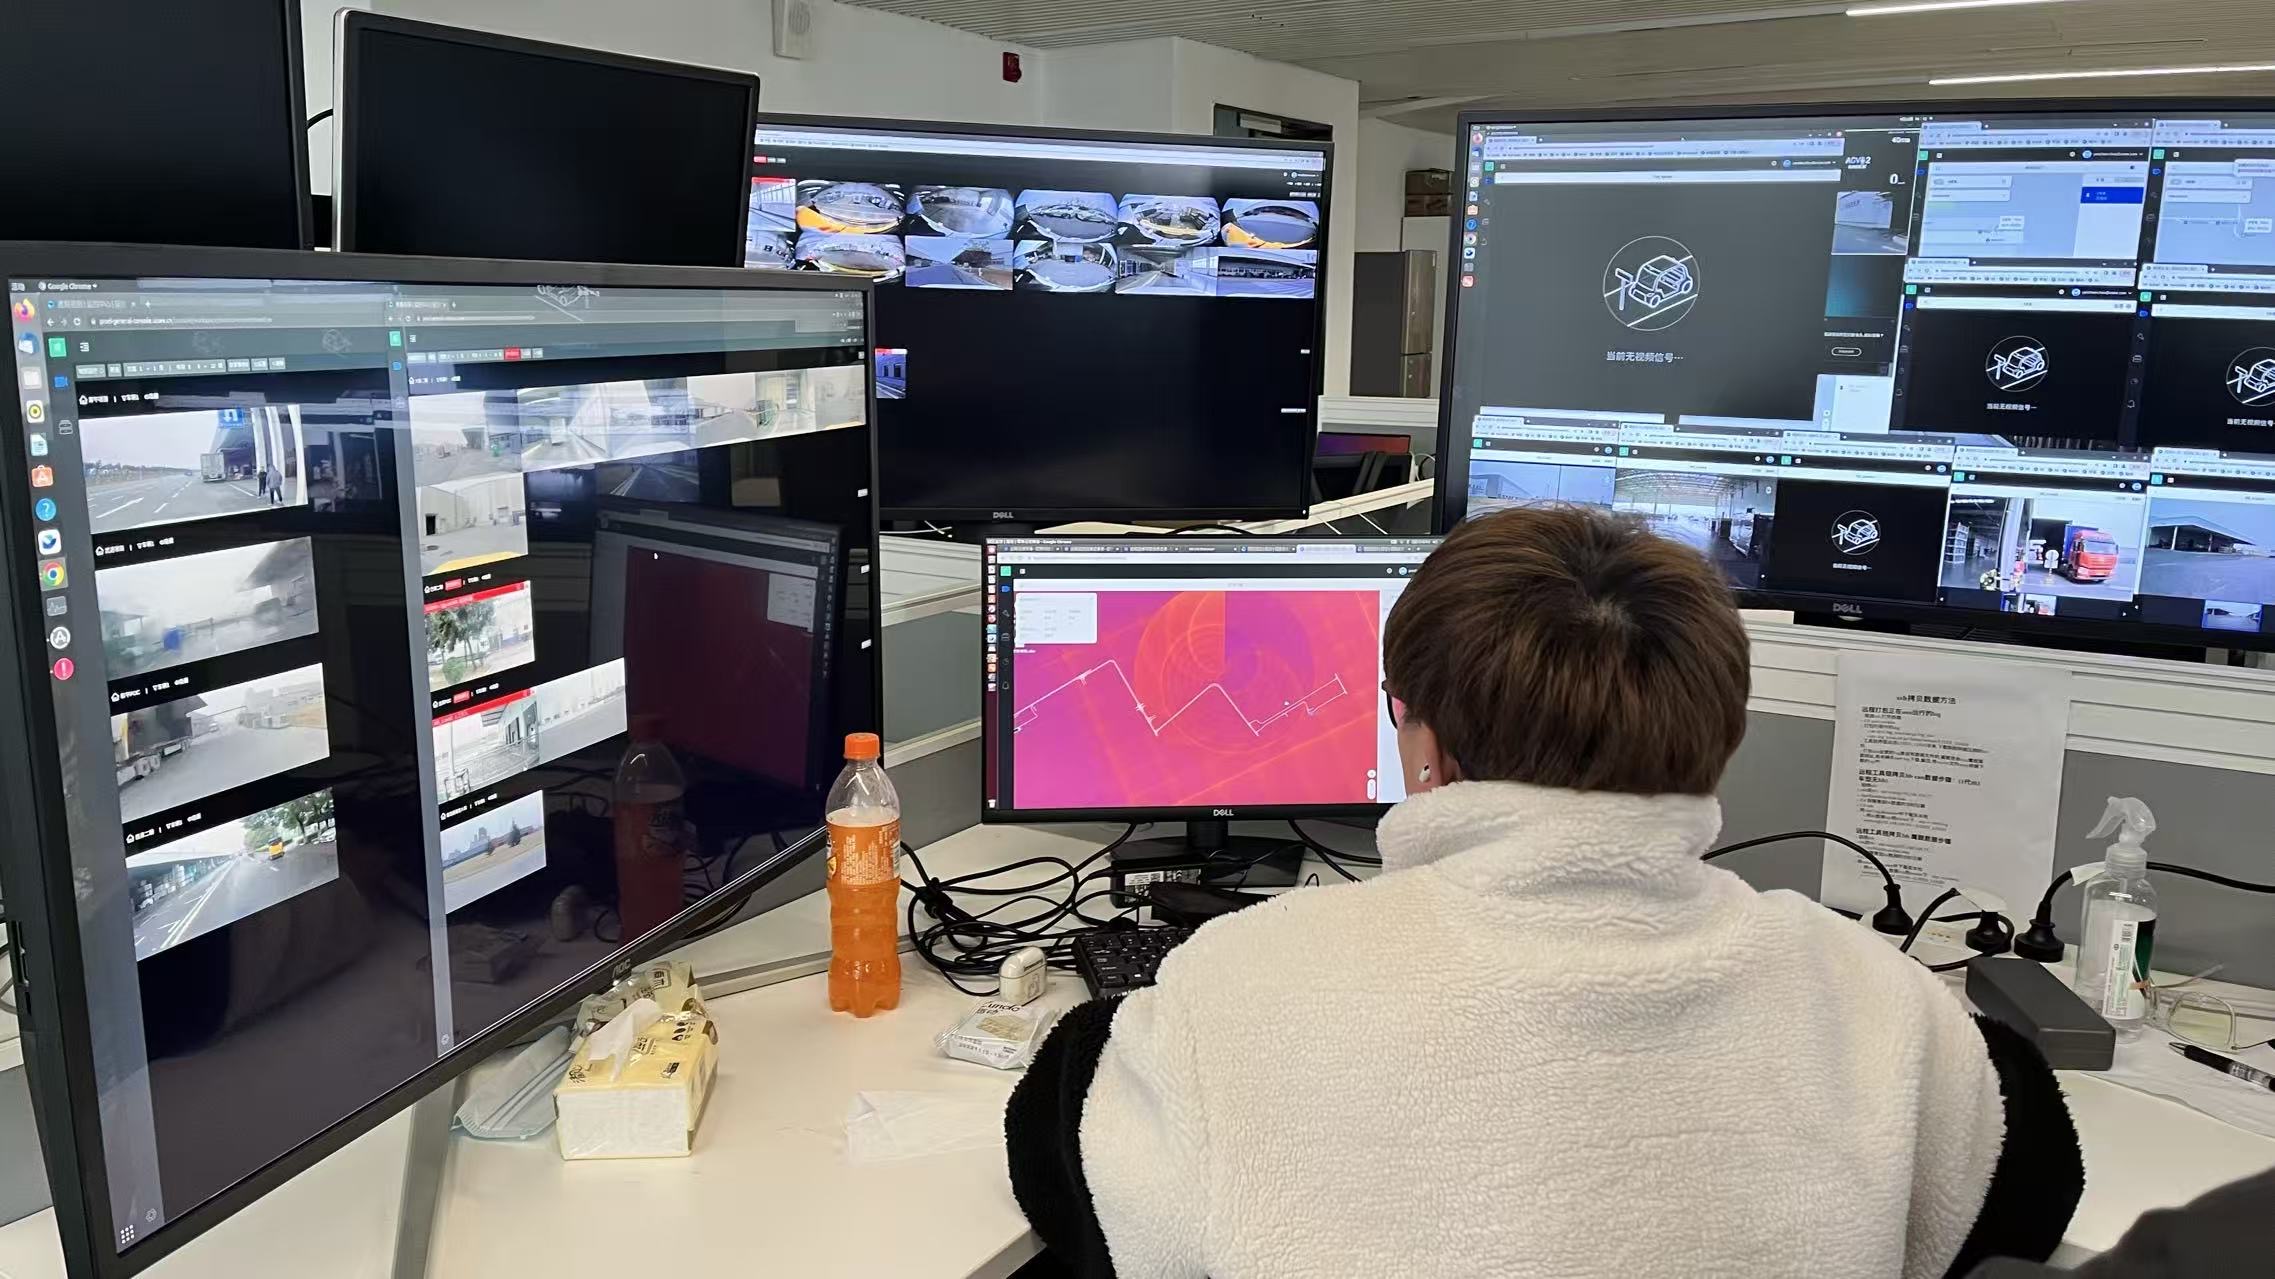
To break free from the constraints of "closed-loop development", I traveled from UISEE's Shanghai R&D center to the Wuhan Operations Center in 2023 for an in-depth field research visit. Through intensive interviews with 20 operations staff working rotating three-shift schedules — monitoring multi-screen stations around the clock — I discovered that the real challenges were far more complex than anticipated. Under the existing "single-vehicle surveillance" model, operators were prone to fatigue and cognitive overload, with significant delays in detecting anomalies. The key challenges identified at the outset were:
Defining an uncharted operations paradigm:With no established reference model, how do we define a standardized interaction workflow for operators — covering everything from anomaly detection to remote intervention?
Visual re-encoding of extreme data dimensionality:With 400+ mobile endpoints streaming terabytes of data in real time (video feeds, sensor telemetry, path information), how do we perform lossless dimensionality reduction on a single platform and translate it into intuitive visual feedback?
Cross-disciplinary collaboration boundaries:As a ground-up project, we needed to deeply align the underlying algorithmic logic of the autonomous vehicle brain with the performance limits of the frontend display — finding the optimal balance between technical feasibility and peak user experience.
Design Goals
Following a series of interviews and in-depth reflection, we defined the design goals for this new central operations platform as follows:
User Personas
Drawing from in-depth interviews with 20 front-line operators at the Wuhan Operations Center, I built the core user model. These are not merely the audience for visual design — they are the definers of system logic.
Scenario Simulation
To ensure full-scenario coverage from zero to one, I consolidated the fragmented situations captured during field research into three standardized business scenarios and conducted an interaction walkthrough for each.
Competitive / Reference Research
We analyzed leading design systems including Material Design, Atlassian Design System, IBM Carbon, and Shopify Polaris. This research helped us understand best practices in component architecture, documentation structure, accessibility implementation, and design token management.
Design System Architecture
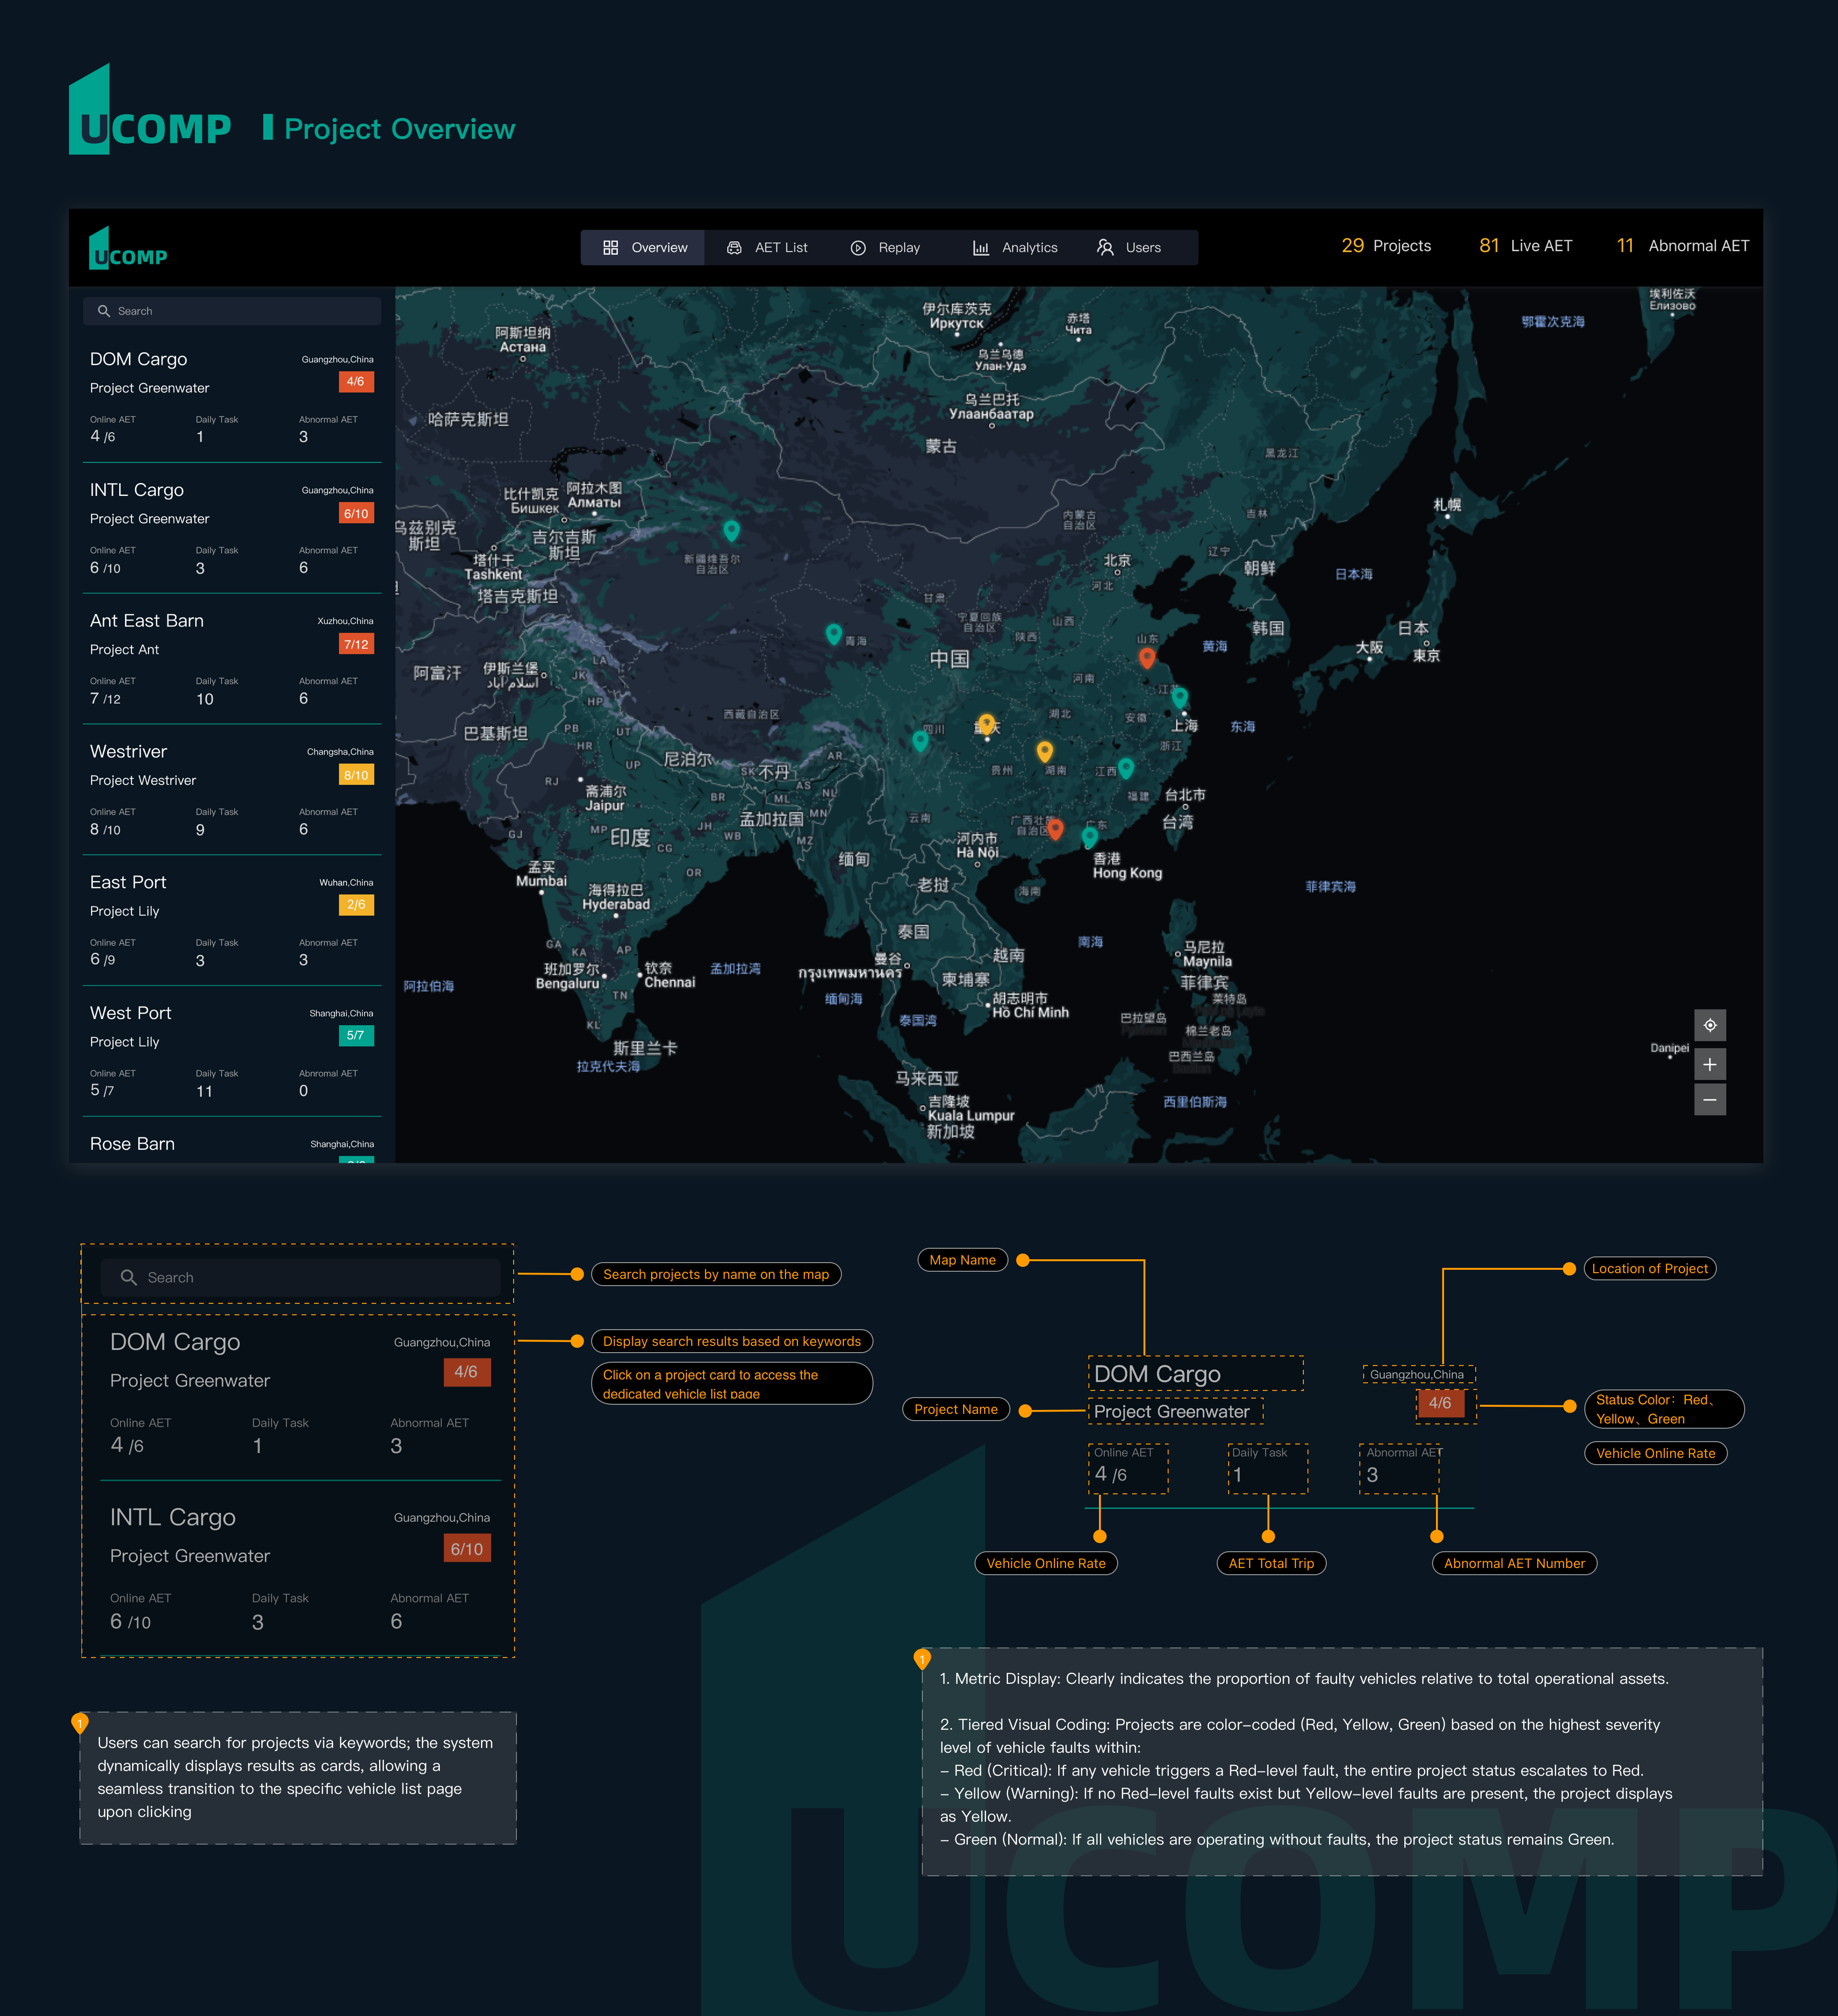
Facing real-time dynamic data continuously streamed back from 400+ autonomous vehicles, the sheer volume of data made tiered management of such a large fleet the primary challenge I had to address. The greatest design challenge lay in balancing comprehensive monitoring with focused operation. To this end, I built a "funnel-style" information filtering architecture — through view-switching across three dimensions, operators can maintain both a global overview and micro-level focus, enabling meaningful conversion of massive data into high-value decision information:
Design Tokens
We established a comprehensive design token system that serves as the single source of truth for all design decisions. Tokens cover colors, typography, spacing, borders, shadows, and animation timings. This approach ensures consistency across platforms and makes theme customization straightforward.
Visualization Map Design
绿色代表正常运行车辆,橙点为待处理异常,红点带脉冲光晕表示需要立即介入的紧急故障,运维人员无需阅读数字即可完成第一层级的状态判断。
地图以实际项目所在地划分区域边界,运维人员可快速建立空间方位感,并与左侧 Zone Status 侧栏中的区域卡片形成视觉呼应。
点击异常车辆节点时,深色气泡卡片即时呈现区域编号与故障摘要,运维人员无需跳转页面即可获取上下文信息,判断是否需要下钻处理。
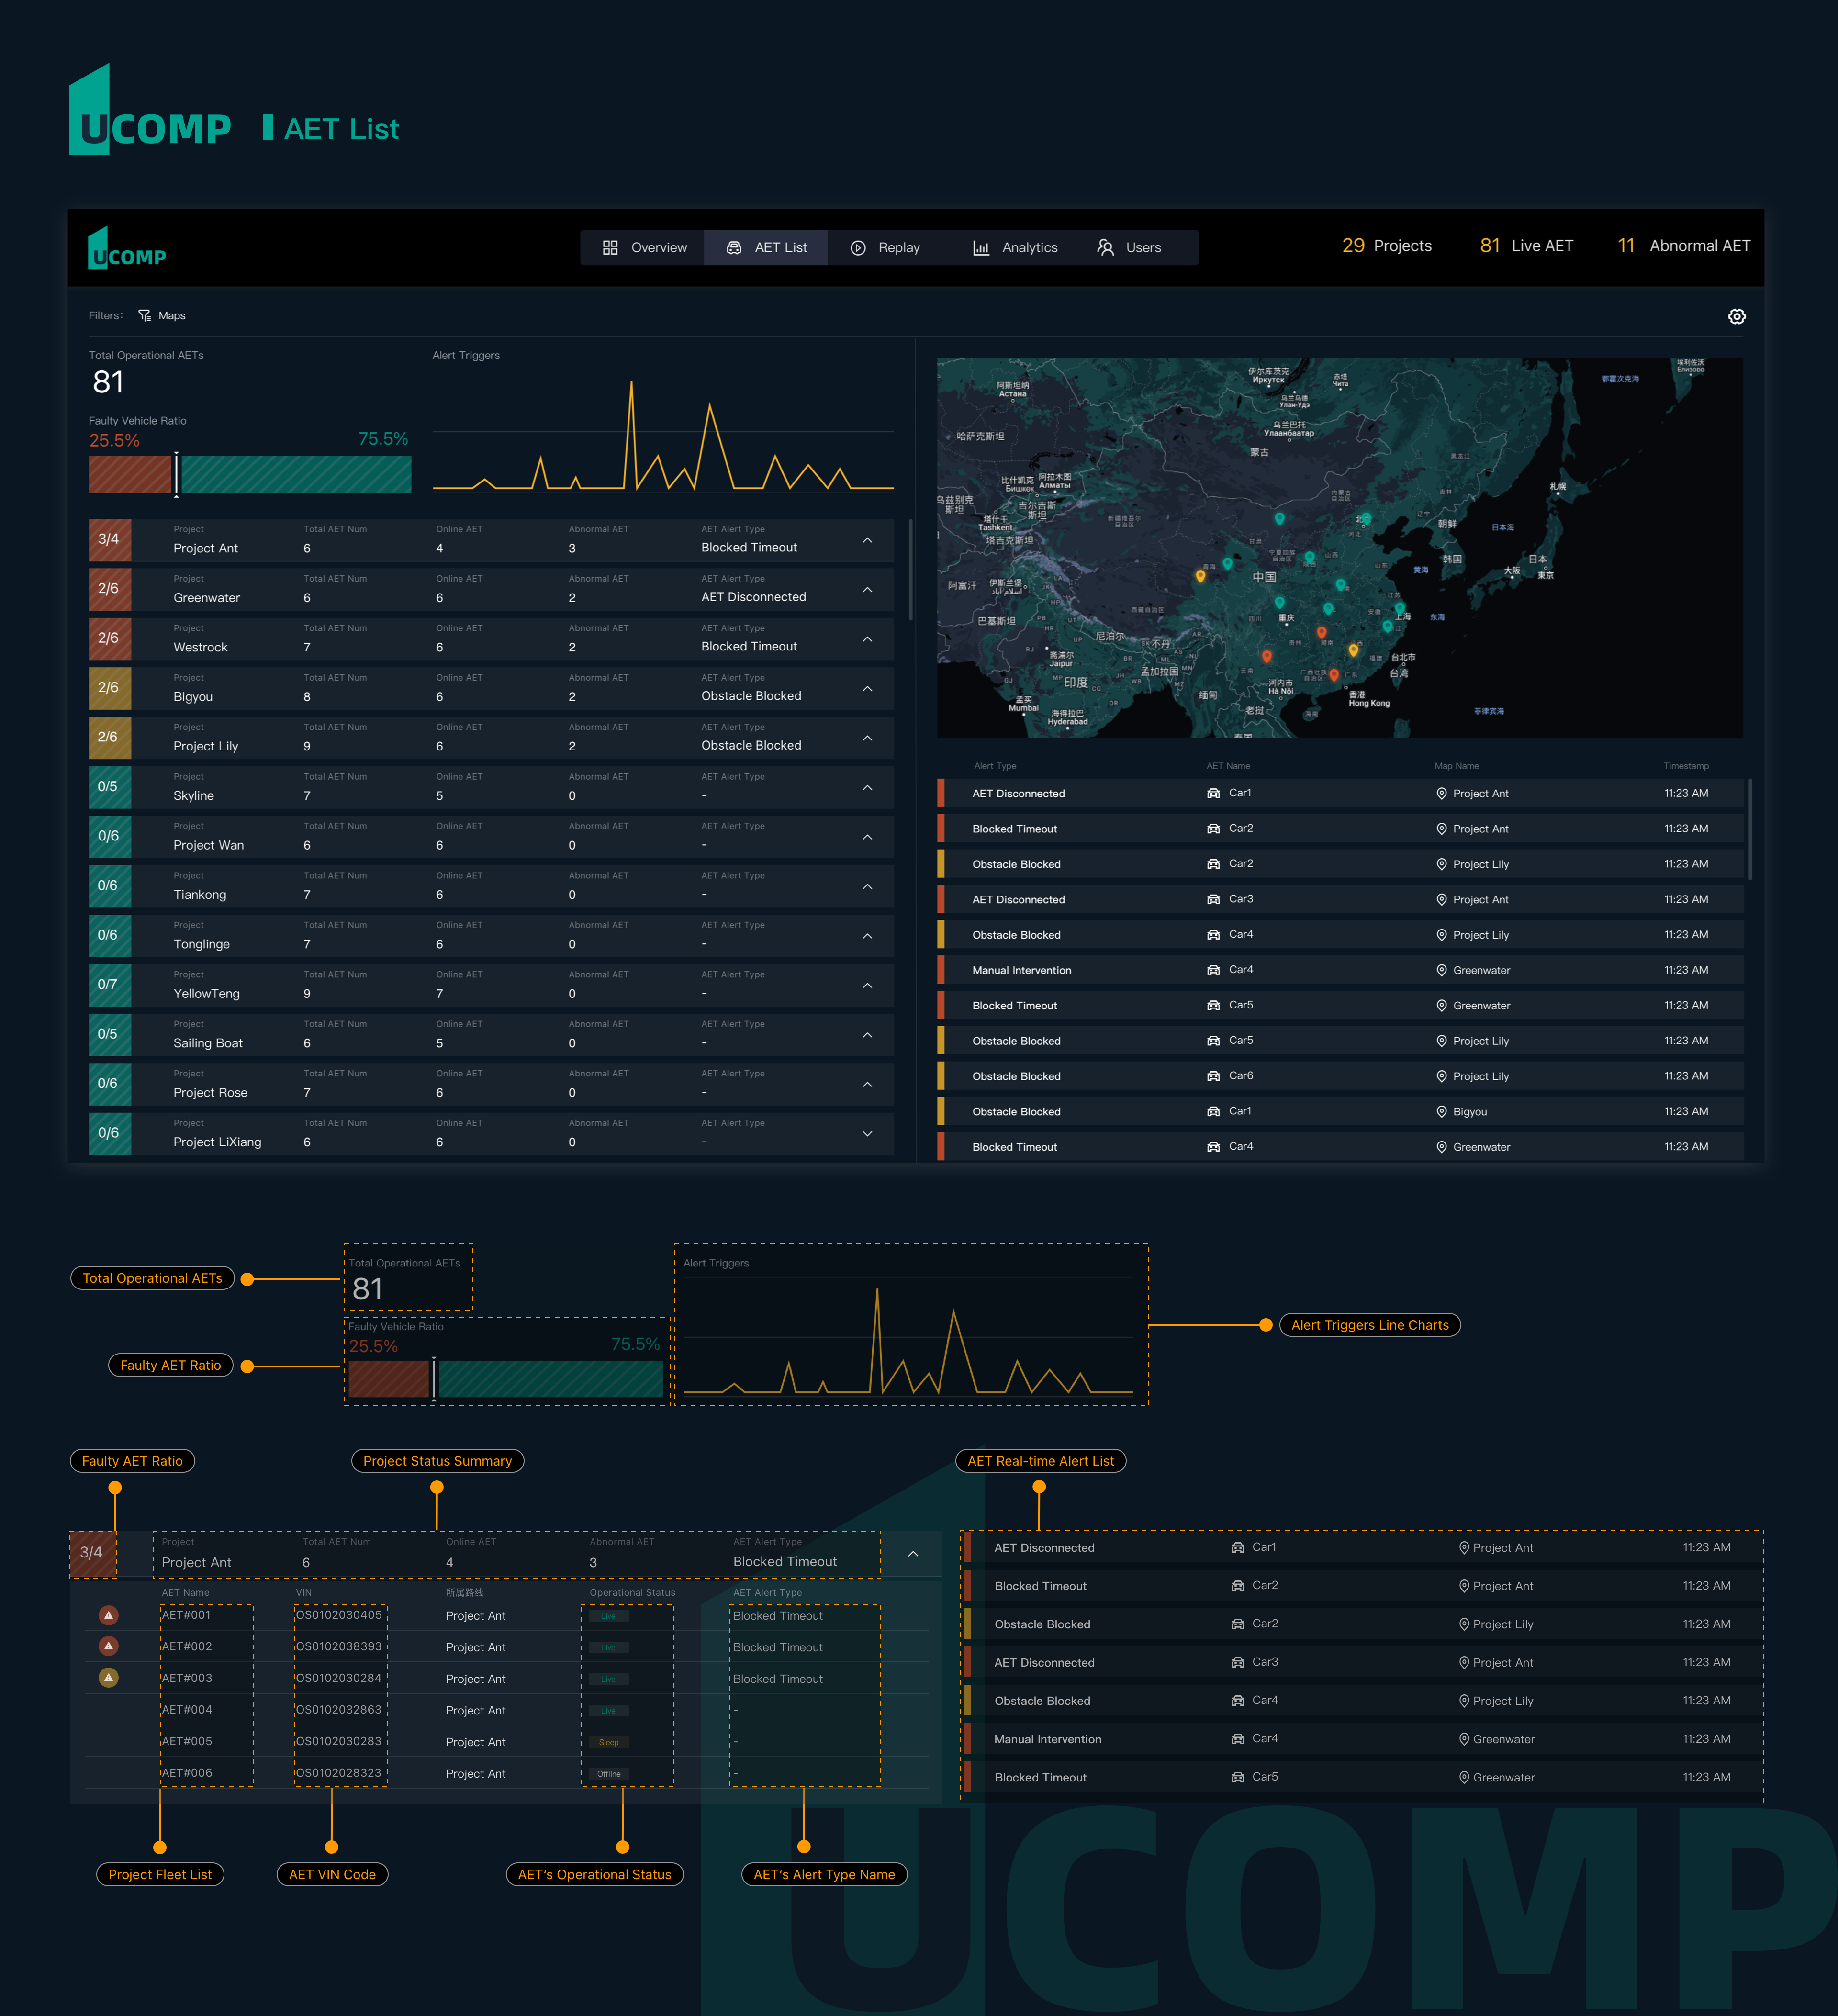
Anomaly Alert Grading System
如何让运维人员在 1 秒内发现最紧急的问题是在用户调研中常常提及的问题,因此将无人车所涉及到上百种告警内容,我们需要进行分级响应。
为了防止突发的"报警风暴"(例如基站抖动导致 50 辆车同时报错),我引入了"报警融合机制"。系统自动识别同源报警,将散点报警归纳为一个聚合预警。运维人员只需处理这一个根因节点,极大降低了瞬间认知过载。
将无人车告警通知整合分级,定义了 L1(致命故障 - 需立即接管)、L2(一般异常 - 需关注)、L3(系统提醒 - 需知晓)的三级报警逻辑。并针对不同等级告警所呈现不同的颜色及声效。
针对凌晨时段(疲劳期),报警频率和视觉反馈强度会动态提升,确保运维人员能时刻保持警惕。
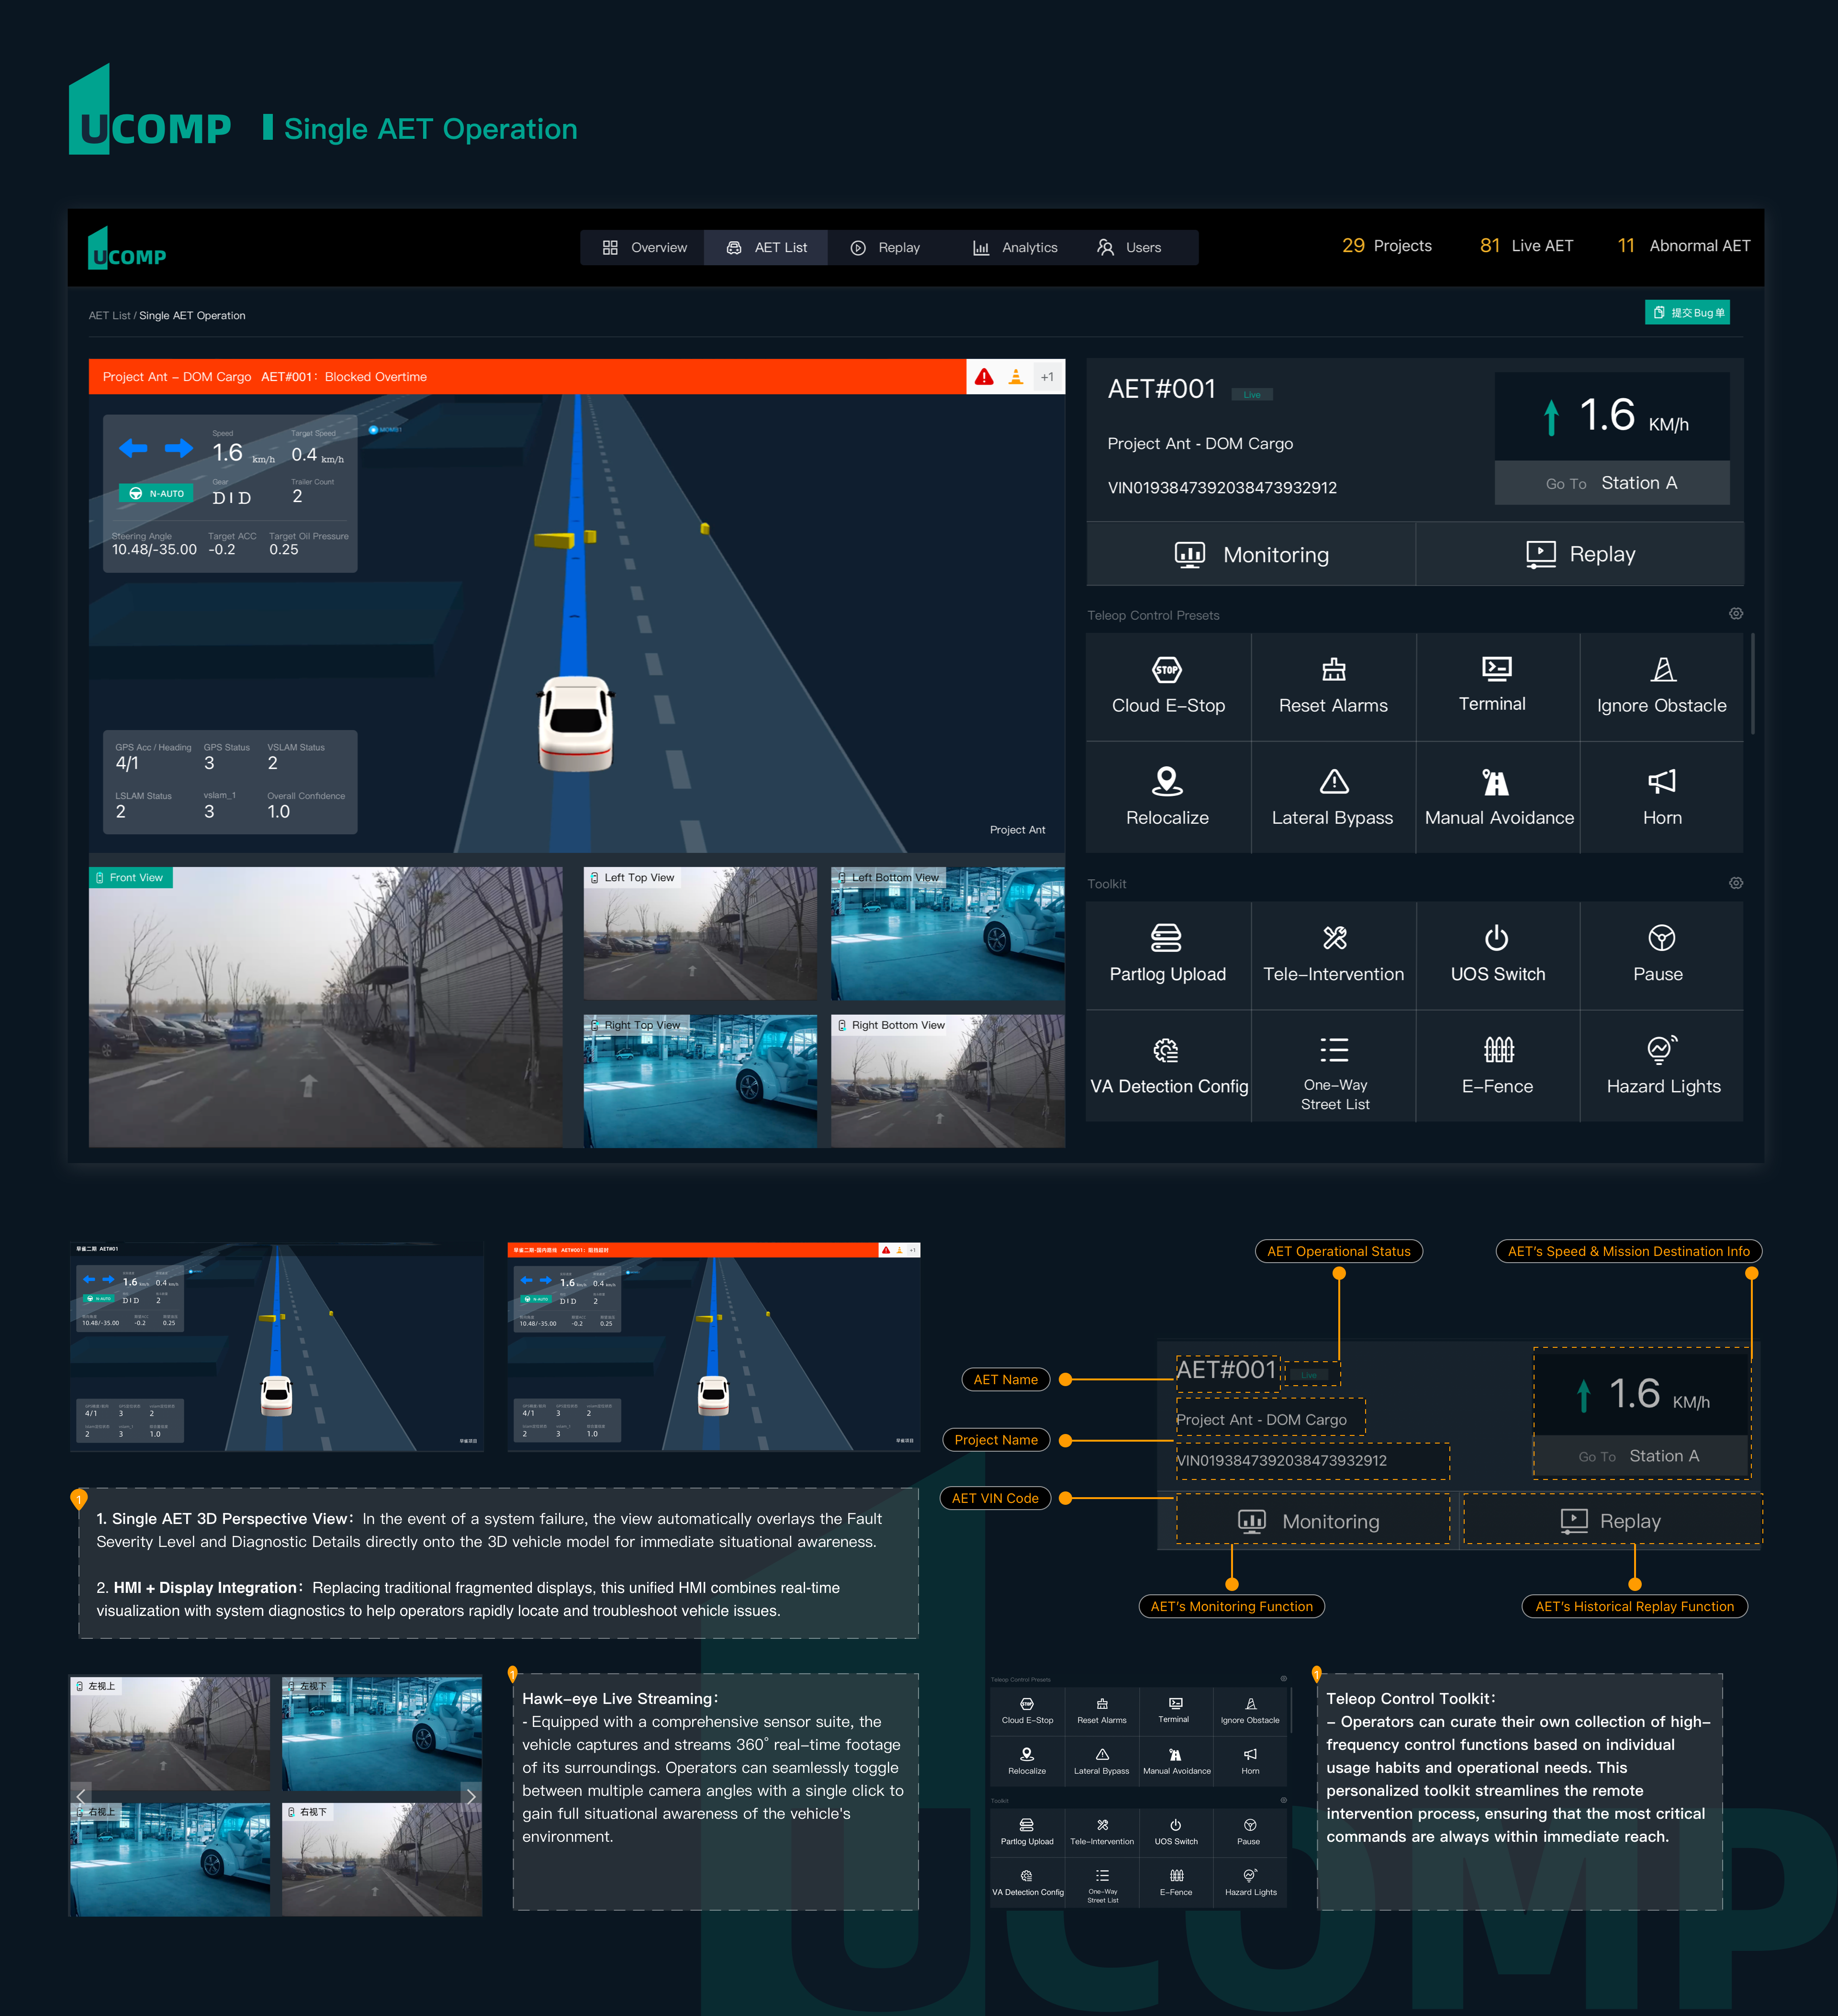
Remote O&M Suite
从发现异常到手动远程干预的流程,需要在无人车单车运维界面完成最后的闭环路径。
在全局地图页上集成「一键接管」入口,打破复杂菜单寻找车辆的繁琐,确保运维人员的注意力 100% 聚焦在当前脱困任务上。
为了解决远程控制中不可避免的网络延迟,我在控制台中叠加了 3D 激光雷达点云与视频流的融合视图,帮助运维人员更好参考无人车实时周遭环境,降低误操作风险。
设计了明确的接管权限确认流(空闲 → 申请中 → 操控中 → 释放),并包含「一键释放权限」与「紧急制动」按钮。通过这种严格的交互协议,确保在 20 名运维人员并行作业时,物理安全得到绝对保障。
品牌语言
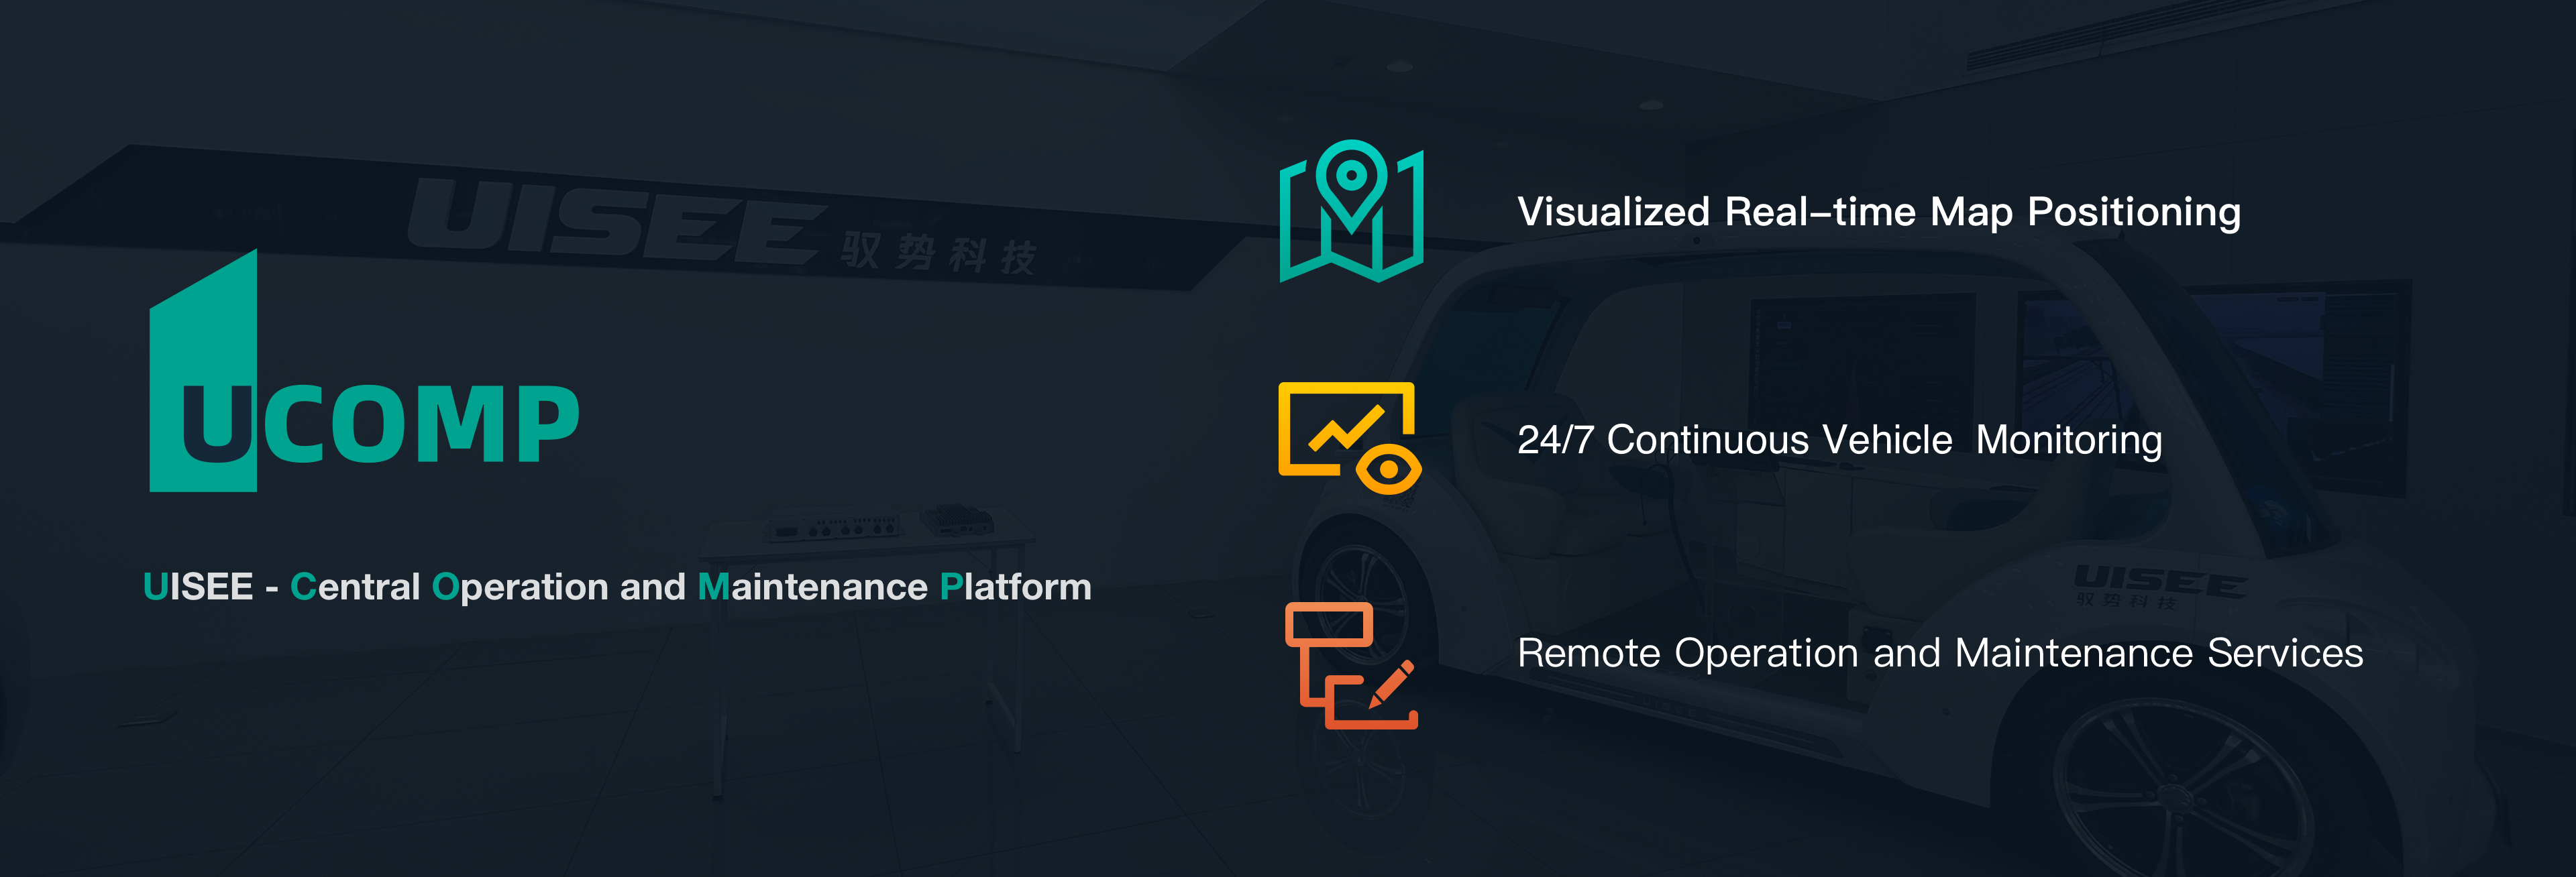
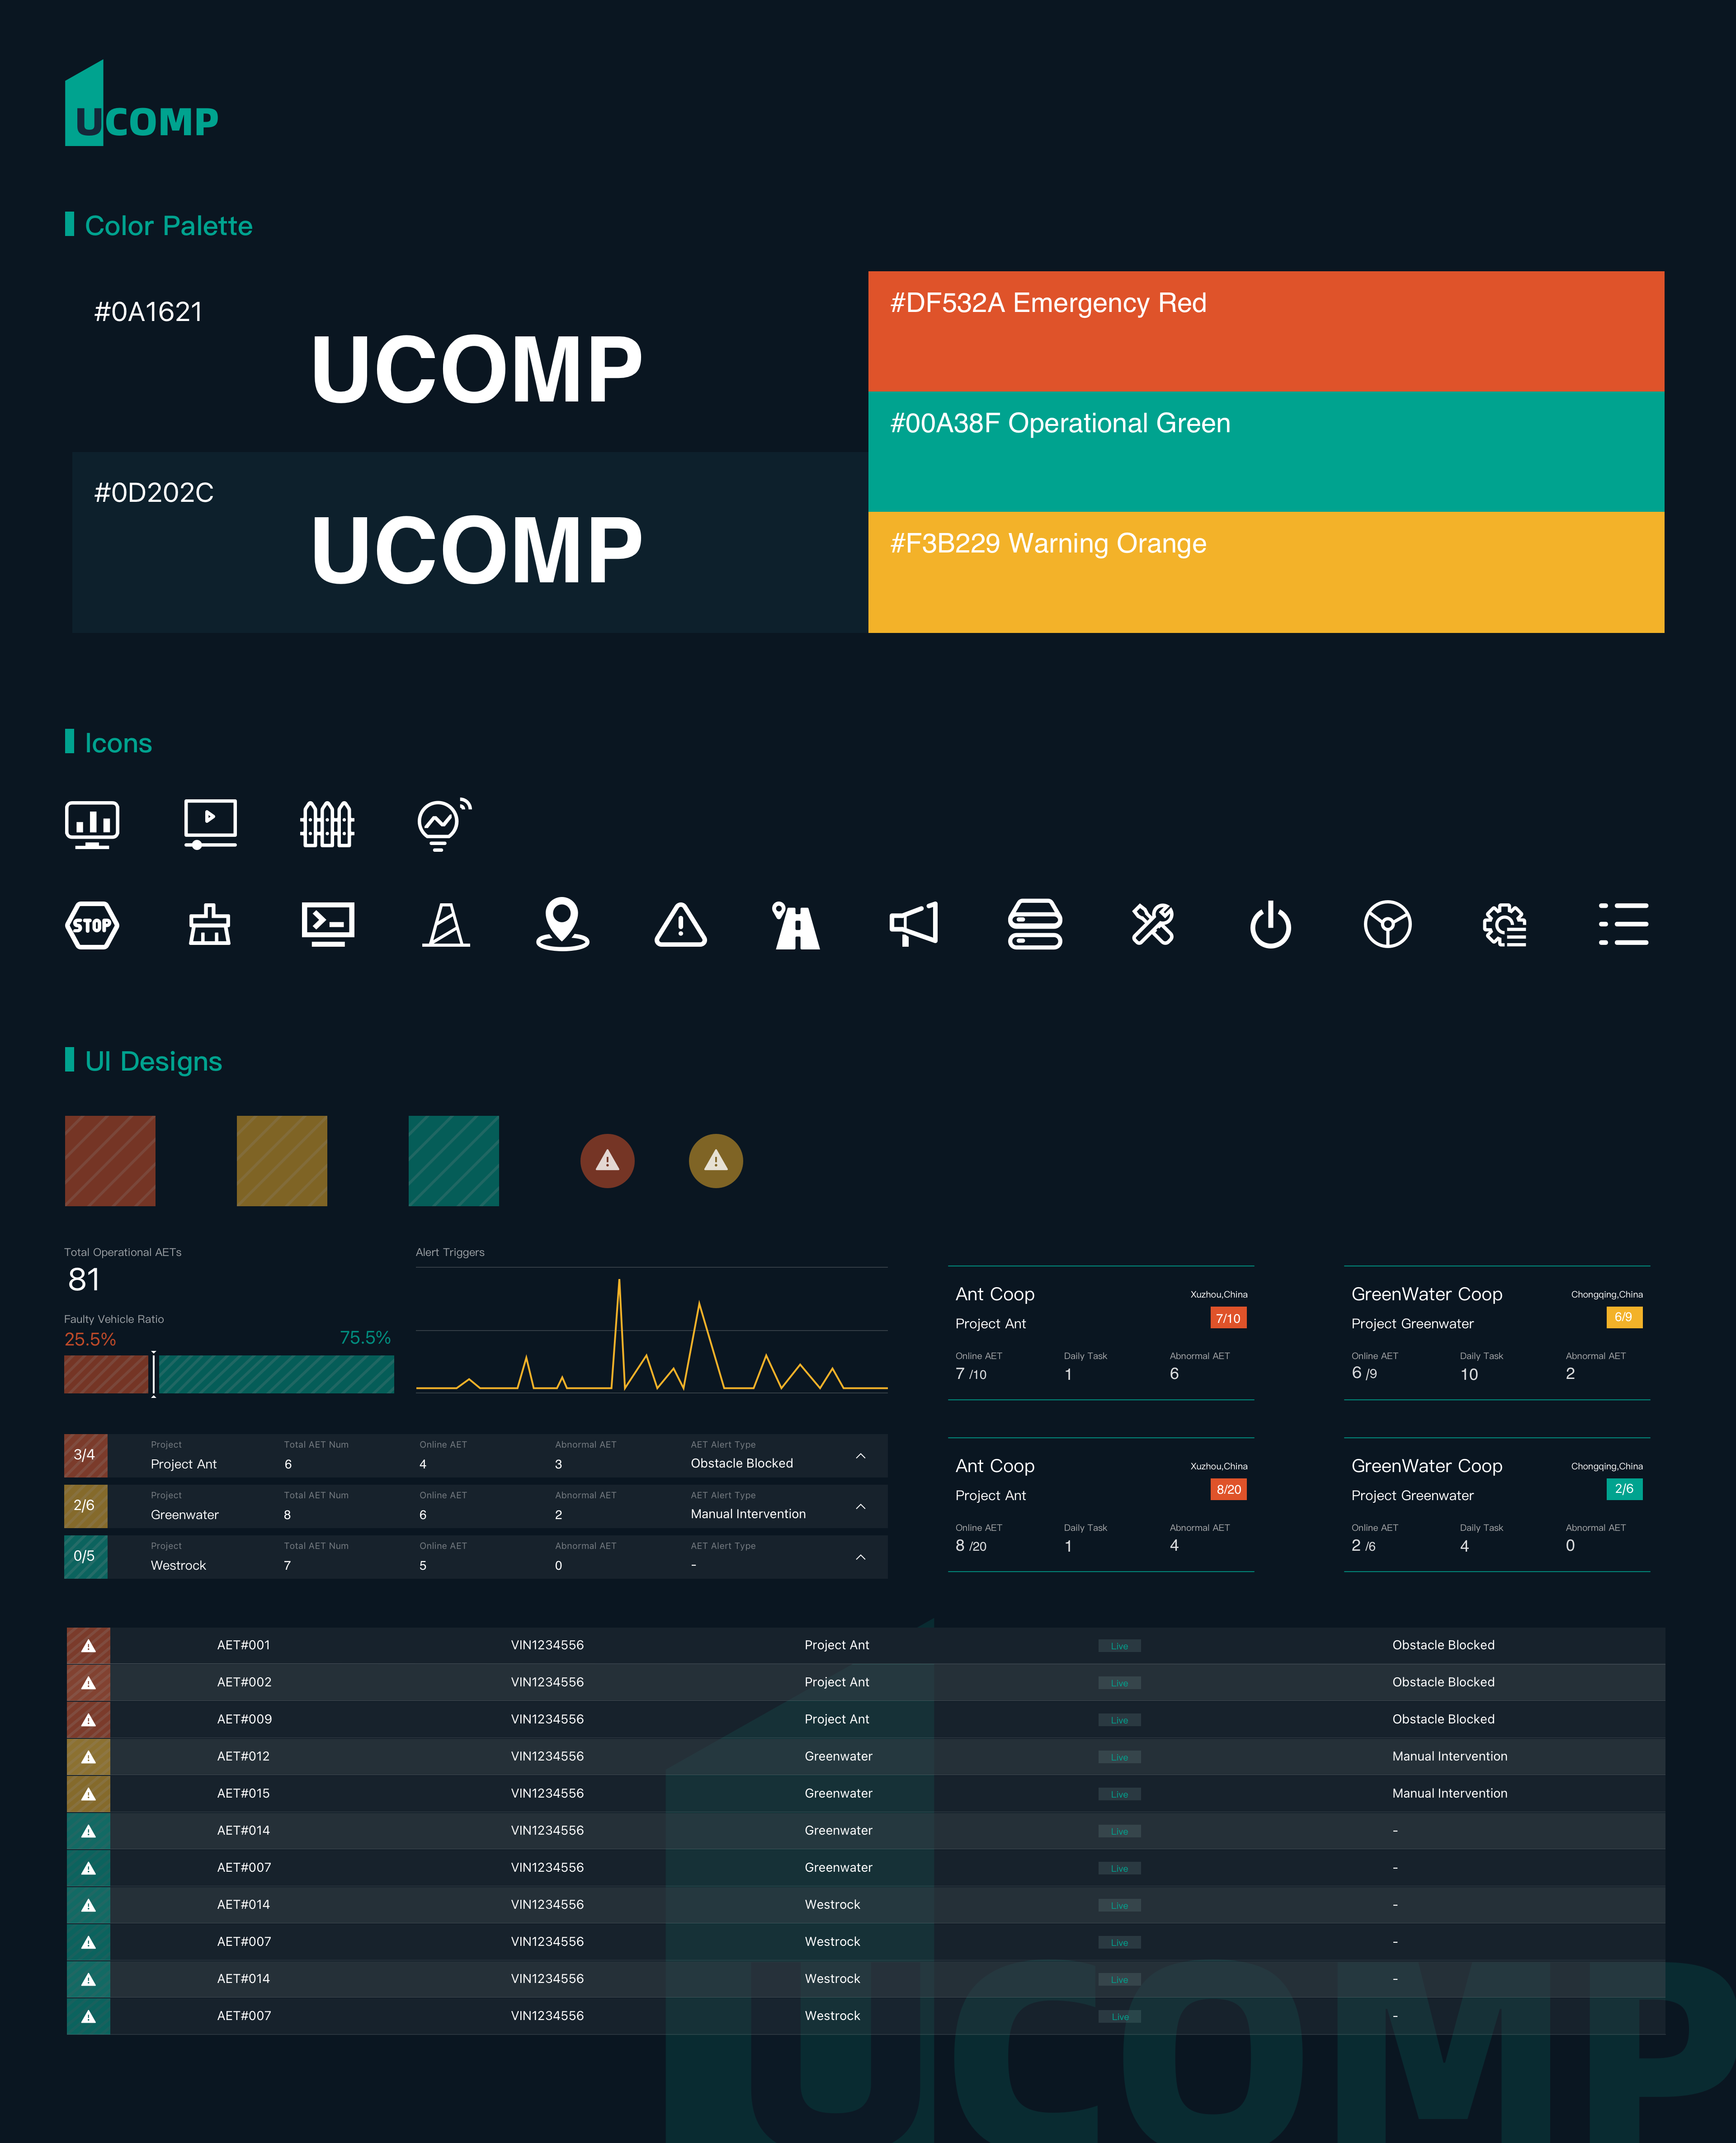
品牌命名源自 UISEE Central Operation and Maintenance Platform 的首字母缩写,传递出系统化、专业化的产品定位。品牌标识以象征「U」的建筑结构图形为原型,结合主题绿(#00A38F)与深色背景,构建清晰有力的视觉识别。整体品牌语气严谨高效,面向专业运维人员,摒弃一切冗余的装饰性元素。
视觉体系
视觉体系以深色优先为核心原则,降低长班运维中的视觉疲劳。色彩系统结构化地传递运营状态:主题绿(#00A38F)代表正常,琥珀色代表预警,红色代表紧急告警。字体层级经过严格设计,针对高密度数据场景保证可读性,配合统一的间距与网格系统,使界面在信息密度极高的情况下仍能保持视觉秩序。
高保真功能交互
高保真原型覆盖了完整的运维闭环——从车队概览到单车远程干预。关键交互包括:具有分级视听反馈的告警通知系统、带权限状态流转的一键接管流程(空闲 → 申请中 → 操控中 → 释放),以及用于远程驾驶参考的 3D 激光雷达与摄像头融合视图。所有交互均基于真实运维场景验证,以确保决策速度和防误操作能力。
成果与影响
实际落地及规模化运营
UCOMP 已在驭势科技多个商业落地项目中稳定运营,覆盖国内外多个物流园区与无人配送场景。平台实时监管超过 400+ 辆在线无人车,支持 20+ 运维人员并行作业,系统日均处理告警事件数千条。规模化部署验证了 UCOMP 在高并发、复杂场景下的可靠性与稳定性。
Online Vehicles Monitored
Concurrent Operators Supported
Cities in Operation
Years of Commercial Operation
行业认可与荣誉
UCOMP 的设计成果获得了行业的广泛关注与认可。项目获得多个设计奖项提名,并在自动驾驶运营领域的行业会议中被作为典型案例分享。UCOMP 的设计方法论也为公司后续产品的设计规范建立提供了重要参考。
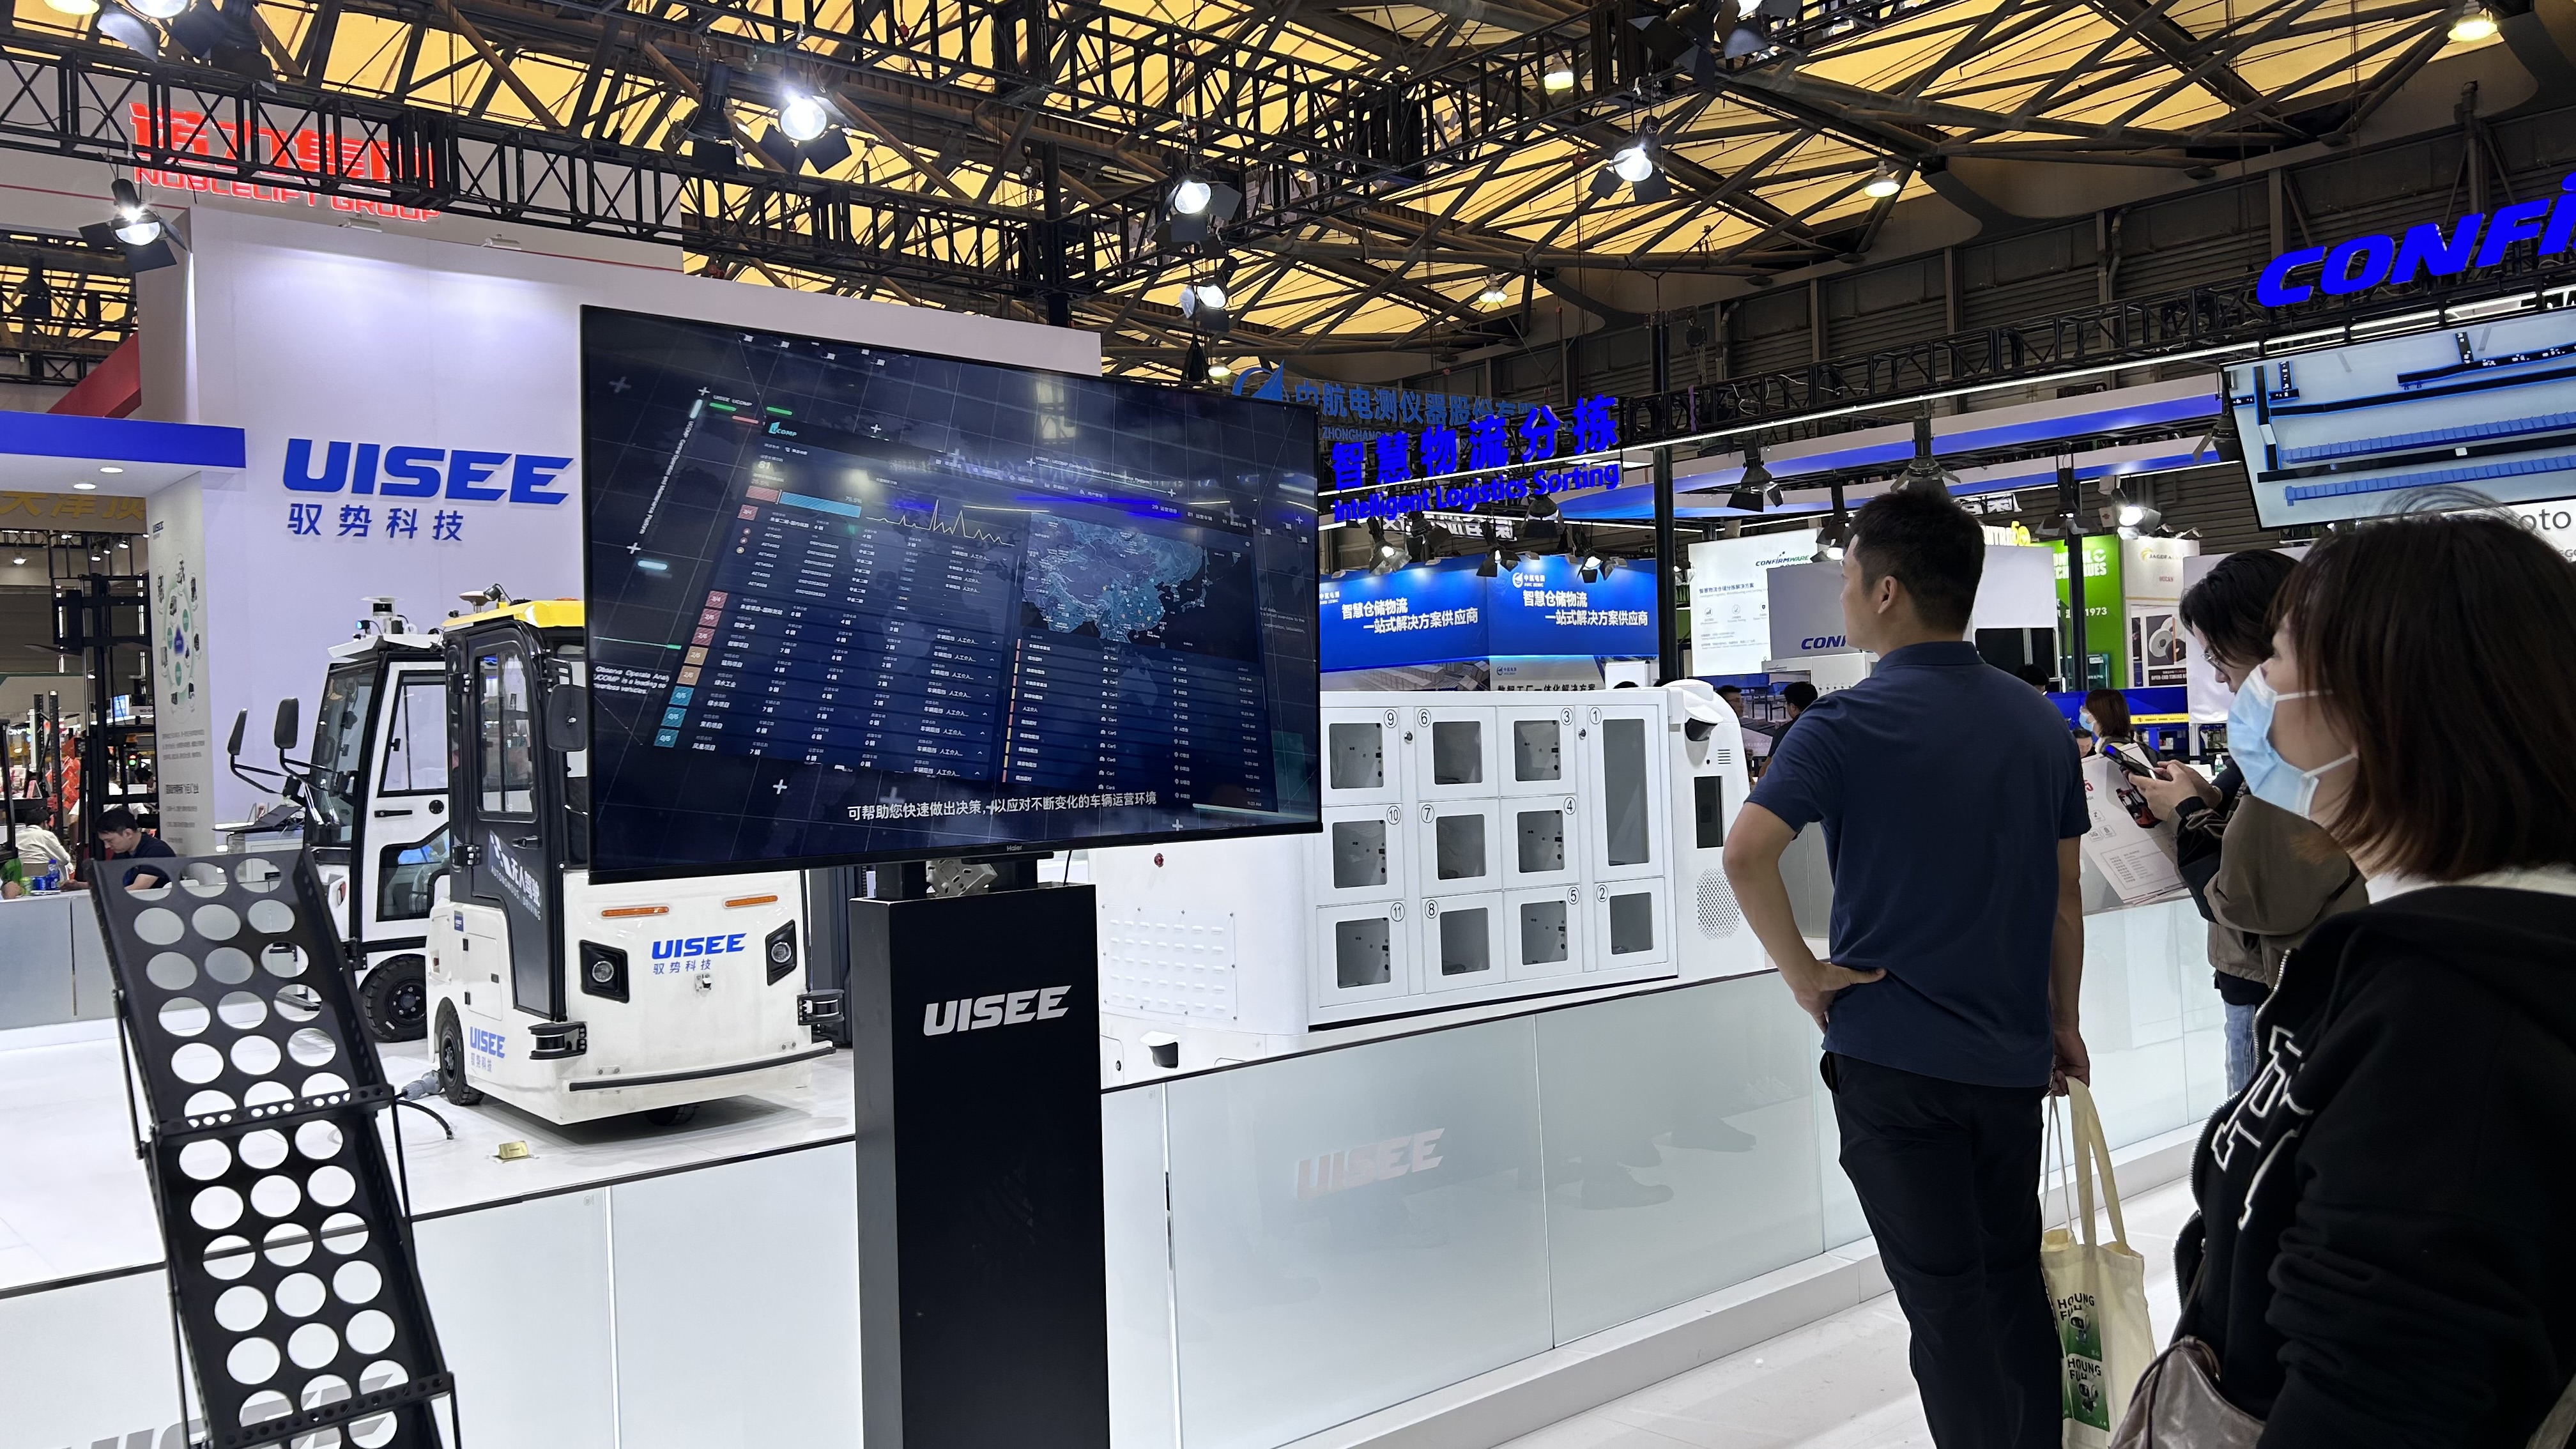
作为 UISEE 核心软件产品,UCOMP 代表公司参展中国国际工业博览会(CIIF),我使用 Adobe After Effects 独立完成了一个 UCOMP 产品宣传视频用于在博览会展出,向行业展示了 L4 级自动驾驶的数字化管控能力。
凭借出色的交互逻辑与系统稳定性,本项目在中国信通院(CAICT)主办的「2023 系统稳定性与精益软件工程大会」中荣获【智能网联汽车远程运维平台要求:全面级三星】奖项,得到了国家级智库专家的专业认可。
经验总结
用户高压下的"信息降噪"
在复杂的工业级产品设计中,深入的用户研究是一切的起点。我意识到,运维人员在面对 400+ 辆无人车时,真正的敌人不是"数据不足",而是"信息过载"。通过影子观察和对比测试,我发现视觉疲劳是导致漏报的关键。因此,我的设计决策从"展示所有数据"转变为"只在必要时展示关键异常",这种从监控到基于异常的管理的思维转变,是 UCOMP 成功的核心。
安全与效率的共生
安全与效率并不对立。在远程接管这种秒级响应的场景下,任何模棱两可的反馈都是致命的。通过建立严格的交互协议,例如建立"目标值与实际值的实时对比视觉",我们在保障操作安全的同时,最大化了决策速度。这种"确定性"设计减少了操作员的犹豫时间,建立起了人与机器之间的数字信任。
设计系统的可持续性
设计系统的建立需要持续迭代,而非一次性交付。在 UCOMP 从 0 开始到后续迭代的演进中,我建立了一套原子化组件库。随着业务从单一机场扩展到多城市、多机型,这套系统展现了极强的适配性。它不仅仅是视觉规范,更是业务逻辑的标准化工具,让后续的功能扩展速度同样也显著提升。